


Methodology for Using AVG Diagrams in Ultrasonic Flaw Detection.
For a non-destructive testing specialist, an AVG diagram (Amplitude — Distance — Diameter) is the main tool for transitioning from amplitude values to a dimensional assessment of a defect.
Physical Meaning and Structure of the Diagram
An AVG diagram is a family of curves displaying the change in echo-signal amplitude with depth for reflectors of a given diameter (flat-bottomed holes). In the coordinate axes:
-
Abscissa axis (X) — depth of the reflector (mm) from the ultrasonic wave entry surface;
-
Ordinate axis (Y) — signal amplitude, in relative units or decibels.
Each curve in the diagram field is a function A = f(H) for a fixed reflector diameter (1 mm, 2 mm, 3 mm, etc.).
The diagram is initially calculated for strictly defined conditions — operating frequency, piezoelectric element diameter, entry angle, and acoustic properties of the material (sound velocity, attenuation). Any change in these parameters requires rebuilding the diagram.
Intended Application
In practice, the AVG diagram is used in two modes:
Determining the equivalent defect size
From the depth of occurrence and the measured amplitude, we find a point on the diagram field. The intersection with the nearest curve gives the diameter of the flat-bottomed reflector that would produce an identical amplitude signal under the same conditions. This is not the true size of the defect, but a calculated equivalent.
Setting the instrument sensitivity
The diagram makes it possible to set search, rejection, and reference levels without mass-producing specimens with flat-bottomed holes. It is sufficient to have one or two specimens to tie the AVG diagrams to a point (it is even possible to use an ordinary bottom signal), and all other levels can then be obtained automatically.
Scope of Applicability and Limitations
The method yields reliable results only for defects with a reflecting plane perpendicular to the acoustic axis of the transducer.
These are flat-bottomed holes, disks, and flat areas of delaminations.
For defects of other morphology:
-
cracks with arbitrary orientation;
-
corner reflectors;
-
extended inclusions of irregular shape;
the AVG diagram gives a deliberately underestimated equivalent size, since the real reflection coefficient is lower than that of a flat-bottomed hole of the same area. In such cases, additional verification is required by the shadow method, echo-mirror method, or TOFD defect sizing.
Critical Factors Affecting Reliability
Ultrasonic attenuation
Real materials have an attenuation coefficient that depends on structure and frequency. The AVG diagram must be constructed taking attenuation into account for the specific grade of steel or alloy. Otherwise, at large depths the error can reach 6–12 dB.
Acoustic contact and surface roughness
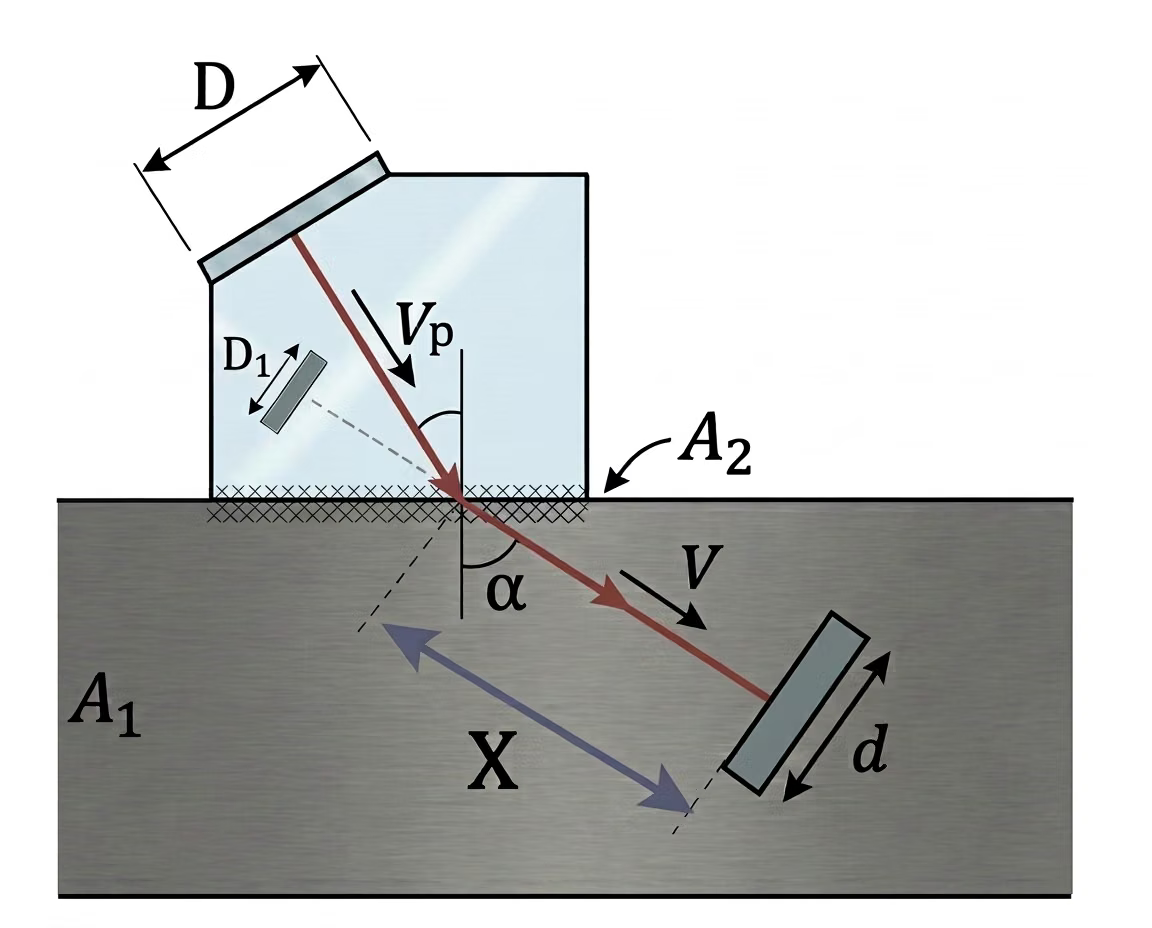
By default, the value of ultrasonic wave attenuation during passage from the transducer into the test object through the contact medium is set to A2=0 dB. In reality, additional losses may occur due to surface roughness, poor fit of the transducer to the surface, and the properties of the contact medium. These can be taken into account by increasing the value of A2. Usually it lies in the range of 0 - 5 dB.
Tie-in to a specific transducer
The AVG diagram is rigidly tied to:
- • transducer frequency
- • piezoelectric plate diameter;
- • entry angle (for angle-beam probes);
- • wedge parameters (for angle-beam probes)
Changing any of these parameters changes the appearance of the AVG diagrams
Features of Interpretation for Complex Defects
The equivalent reflector diameter obtained from the AVG is a conventional quantity.
For cracks, especially those with a small opening, the real geometric dimensions may be 2–3 times larger than the equivalent diameter. Therefore, inspection reports must necessarily state that the measurement was performed by the echo method with AVG-based evaluation.
The AVG diagram makes it possible to standardize ultrasonic testing and make it reproducible regardless of the operator. However, it is not a universal measuring device — it is a tool for comparison with a reference.
A competent specialist uses it in combination with other methods, always remembers its limitations, and performs testing with mandatory verification on standard specimens.